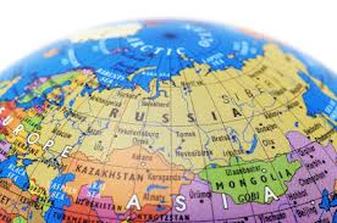

Demographics - The Russian Federation is the largest of the 21 republics that make up the Commonwealth of Independent States. Most of eastern Europe and north Asia is occupied by Russia. It stretches from the Baltic Sea in the west to the Pacific Ocean in the east, and from the Arctic Ocean in the north to the Black Sea and the Caucasus in the south. The many countries that border Russia are: Norway and Finland in the northwest; Estonia, Latvia, Belarus, Ukraine, Poland, and Lithuania in the west; Georgia and Azerbaijan in the southwest; and Kazakhstan, Mongolia, China, and North Korea along the southern border.
Source: http://www.infoplease.com/country/russia.html#ixzz2YT1QWPH5
Russia has approximately 142.9 million inhabitants (according to the 2010 census) - 102 million in the European part, and 41 million in the Asian part.
Mainly the Russians derive from the Eastern Slavic family of peoples, with Turkic (8.4%), Caucasian (3.3%), Uralic (1.9%) and other minorities.
There are as many as 160 different ethnic groups and indigenous peoples in the Russian Federation. In 2002, the census reported that 79.83% of the population (115,889,107 people) is ethnically Russian, and then followed by:
*3.83 % Tatars (5,554,601)
*2.03% Ukrainians (2,942,961)
*1.15% Bashkirs (1,673,389)
*1.13% Chuvashs (1,637,094)
*0.94% Chechens (1,360,253)
*0.78% Armenians (1,130,491)
Source: http://rusemb.org.uk/russianpopulation/
Three quarters of Russians live in the cities. For this reason, Russians are considered an urban-breed. The two major cities are the capital of Moscow - more than 10 million people, and St. Petersburg - more than 4 million. It is estimated that approximately 80 per cent of the population is ethnic Russian. The other 20 percent or so is a mix of other ethnic groups - the Tatars and Ukrainians make the largest minorities.
Source: http://russiapedia.rt.com/basic-facts-about-russia/population/
Russian American Demographics
Russian American population is estimated at approximately 3.13 million people.
The Russian American ethnicity is the second largest ethnicity in the U.S. and represents 10.3% (2.9 Million
people) of the total foreign-born population of 28.4 million. Mexicans are the leading ethnic group and represent 28% or 7.8 million of all US foreign-born population.
The metropolitan gateway for Russian immigrants that have been legally admitted to the United States continues to be the New York Metropolitan area.
After 1985, thousands more Jewish and non-Jewish Russians immigrated to the United States under the more liberal policy of the Soviet government that allowed anyone to leave the Soviet Union under the leadership of Mikhail Gorbachev. Since Russia has become an independent country with a democratically elected government, newcomers cannot justify their claim to emigrate on the grounds of religious or political persecution, which has resulted in a slowing of Russian emigration during the last few decades.
Source: http://www.everyculture.com/multi/Pa-Sp/Russian-Americans.html#ixzz2YTCPkbih
Leading States for Russian Americans:
New York, California, Illinois, Pennsylvania, Massachusetts.
Leading Cities:
New York City, Los Angeles, Chicago, San Diego, San Francisco, Seattle, Detroit.
Percentage Distribution:
*NY Tri-State Area – 24%
*California – 16%
*Illinois – 16%
*Pennsylvania – 10%
*Massachusetts – 8%
*Florida – 7%
*DC and Maryland – 3%
Household
64% are married with an average of 1.6 children per family.
Higher home ownerships rates (57% vs. 41%) and smaller family size (1.60 vs. 2.44) compared to overall US
foreign-born population – translated to more wealth per household.
Incomes
Median Annual Household Income of $50,500. For New York, the median income of Russian-Americans was 47,000 compared to $38,866 for the general population, $42,199 for the Chinese and $19,800 for the Dominican community.
27.4% have an income of $50,000 or more. 23.2% have an income of $25,000 or less.
Education
53% hold a bachelor’s degree or higher.
80.3% have completed a HS Diploma compared to 67% for the foreign born population.
Inclination towards higher education, high-paying employment and general readership.
Employment
Being an educated community, Russian Americans focus more on post-collegiate work participation and are involved in higher-paying employment.
67.5% are in managerial, professional, technical and sales occupations (compared to 45.6% for all foreign-born).
21.4% are involved in service occupations (compared to 31.2% for all foreign-born).
11.9% work as operators, fabricators, and laborers (compared to 18.7% for all foreign born).
0.06% hold farming, forestry, and fishing jobs (compared to 4.6% for all foreign-born).
Labor force participation for the community was 23 years and older (compared to 16 years and older for all foreign-born).
Age
Median age of 32.5 years compared to 38.1 years for all foreign-born people.
Higher population in the age group of 55 years and over (44.1% compared to 17.3% for all foreign-born people).
Lower population in the age group of 0-24 years (8.6% compared to 21% of all foreign-born people) and 25-54 years (47.6% compared to 58.7% of all foreign-born people).
Source: http://www.ameredia.com/resources/demographics/russian.html
http://en.wikipedia.org/wiki/Russian_American
http://www.everyculture.com/multi/Pa-Sp/Russian-Americans.html#ixzz2YTCPkbih
